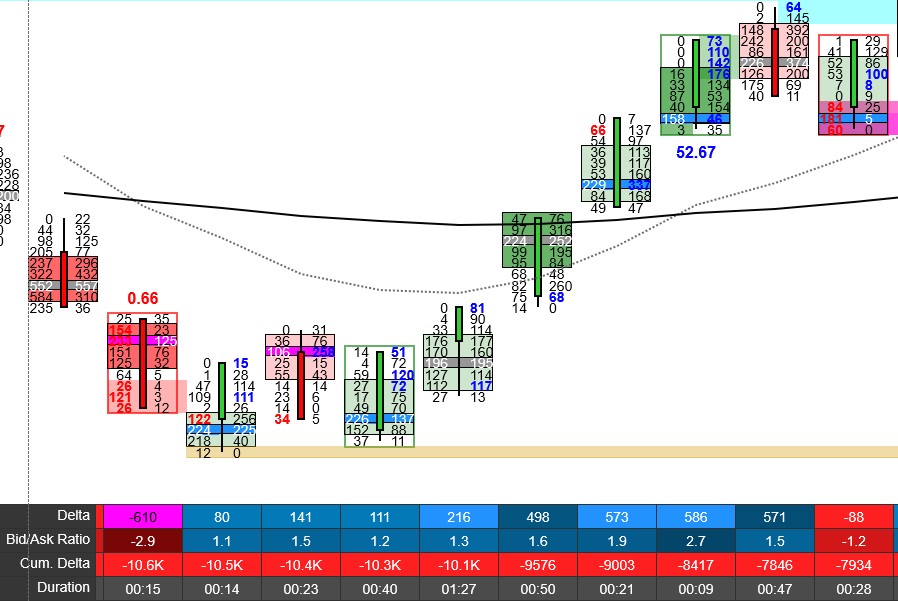
Introduction to Footprint Charts
In the world of day trading financial futures, having the right tools and techniques can make all the difference between success and failure. One such tool gaining popularity among traders is the footprint chart. If you’re new to day trading or looking to expand your toolkit, understanding what a footprint chart is and how it can be used in conjunction with the S&P 500 E-mini contract can significantly enhance your trading strategy.
What is a Footprint Chart?
A footprint chart, also known as a volume footprint or footprint profile, is a type of financial chart that provides detailed insight into the volume traded at each price level during a specific time period. Unlike traditional price-based charts like candlestick or bar charts, which primarily focus on price movements over time, footprint charts offer a deeper analysis of market dynamics by incorporating volume data.
Basic Components of a Footprint Chart
- Price Levels: Like other financial charts, a footprint chart displays price levels along the vertical axis. Each price level represents the price at which trades are executed.
- Volume Profile: The volume profile, represented by bars or colored areas, illustrates the volume traded at each price level. Higher bars indicate greater trading activity, while lower bars suggest less activity.
- Time Period: Footprint charts can be customized to show trading activity over different time frames, such as minutes, hours, or even days. Traders can choose the time period that best suits their trading style and objectives.
- Bid-Ask Spread: Some footprint charts include information about the bid-ask spread, which is the difference between the highest price a buyer is willing to pay (bid) and the lowest price a seller is willing to accept (ask). Understanding the bid-ask spread can help traders assess market liquidity and potential price movements.

How to Use Footprint Charts in Day Trading
Now that we’ve covered the basics, let’s explore how footprint charts can be utilized in day trading, specifically with the S&P 500 E-mini futures contract.
- Identifying Support and Resistance Levels: Footprint charts provide valuable insight into where significant buying and selling activity is occurring. Traders can identify potential support and resistance levels based on areas of high volume and observe how the market reacts to these levels over time.
- Spotting Imbalances: Imbalances between buying and selling volume can signal potential shifts in market direction. By analyzing the volume profile on a footprint chart, traders can identify areas where buyers or sellers are dominating the market, helping them anticipate future price movements.
- Confirming Price Movements: Footprint charts can be used to confirm the strength or weakness of price movements observed on traditional price-based charts. For example, if a candlestick chart shows a bullish reversal pattern, traders can look to the footprint chart to confirm whether buying volume is indeed increasing, providing additional confidence in their trading decisions.
- Executing Trades: Some advanced trading platforms allow traders to execute trades directly from footprint charts, enabling them to quickly react to changing market conditions and capitalize on trading opportunities as they arise.
Conclusion
In conclusion, footprint charts offer day traders a unique perspective on market activity by providing detailed insight into volume traded at each price level.
By incorporating footprint analysis into their trading strategy, traders can gain a deeper understanding of market dynamics, identify key support and resistance levels, spot imbalances, and make more informed trading decisions.
When used in conjunction with the S&P 500 E-mini futures contract, footprint charts can be a powerful tool for navigating the complexities of today’s financial markets. Whether you’re a novice trader or an experienced professional, mastering the art of footprint analysis can help take your trading to the next level.